An Introduction to Prometheus
Originally published in Chinese on 2021-10-21; this English edition preserves the original scope and technical context.
Prometheus is an open source monitoring solution and a graduation project of the Cloud Native Foundation CNCF. It can provide functions such as collection, storage, query, and alarm of indicator data. This article mainly introduces the basic concepts of Prometheus and some issues that need attention in its application.
1 Monitoring system
1.1 Monitoring mode
There are two modes for the monitoring system to perform monitoring checks, namely pull and push. Prometheus uses the pull mode for data collection, and also supports the push mode of Pushgateway for data transfer.
The characteristic of the pull method is that there is a pull interval and the changes in values cannot be obtained in time, so further data processing is required. Its advantage is that it can be fragmented according to the policy when an alarm occurs, only the required data is pulled, and it supports aggregation scenarios. The disadvantage is that the amount of monitored data is huge and has high requirements for storage, so the separation of hot and cold data needs to be considered.
The characteristic of the push method is that the service actively pushes the data to the monitoring system, which is more real-time; its disadvantage is the unpredictability of the push data, because when a large amount of data is pushed to the monitoring system, the caching and parsing of the data will consume a lot of resources. At this time, if the sending and receiving of the data is not confirmed due to network reasons, it is easy to retransmit and duplicate the data, so operations such as deduplication are required.
The pull mode is more advantageous in a cloud-native environment because we can use service discovery to pull unified data from all nodes that need to be monitored. If you use the push mode, you need to deploy a client that reports data in each monitored service and configure the monitoring server information, which will increase the difficulty of deployment.
1.2 Prometheus
Prometheus is an open source data collection and monitoring framework that can monitor and alert background servers. It is used to collect performance indicator data of the service under test, including CPU usage ratio, memory consumption, network IO, etc.
Features
Prometheus has four main features:
- Implement flexible querying of multi-dimensional data models through PromQL; this allows monitoring indicators to be associated with multiple tags, and time series can be sliced and diced to support various query and alarm scenarios
- Defines the standard for open indicator data, allowing you to easily customize the probe (exporter)
- Use the Pushgateway component to receive monitoring data in push mode
- A containerized version is provided
Architecture
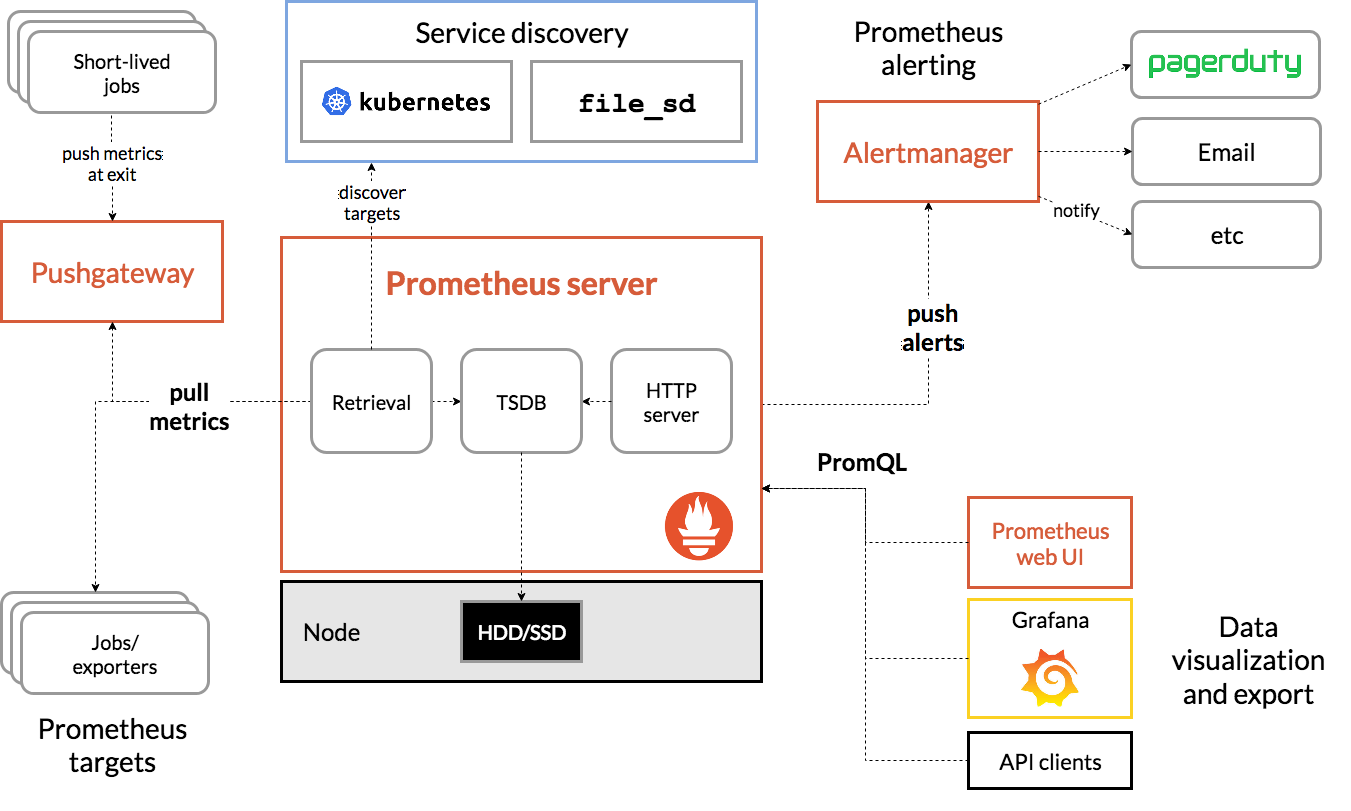
The architecture of Prometheus mainly consists of the following parts:
Prometheus Server
The Prometheus server mainly includes three functions: using pull mode to capture monitoring data, saving data through local storage (local disk) and remote storage (OpenTSDB, InfluxDB, ElasticSearch, etc.), and using PromQL to query data.
PromQL (Prometheus Query Language) is Prometheus’ built-in data query language. It provides support for operations such as querying, aggregation, and logical operations on time series data. It is widely used in data query, visualization, and alarming. For related operations on PromQL, please refer to Exploring PromQL.
2.Pushgateway
Pushgateway is a component used to implement push mode monitoring. It is generally used for short jobs, batch jobs, or when there is network isolation between the service and the Prometheus server. Its main problem is that there is a single point of failure. The downtime of a Pushgateway will cause the loss of all data pushed to this Pushgateway. If a cluster composed of multiple Pushgateway instances is used, each data push will only be distributed to a single instance, but Prometheus Server will be distributed to all of them every time. Data collection on the Pushgateway instance will lead to data confusion. Currently, there is no official solution for this. A better open source solution is to use [dynamic consistent hashing + consul-based service check] (https://github.com/ning1875/dynamic-sharding); in addition, Pushgateway will not automatically delete any indicator data. Even after the pod that has been pushed is destroyed, all the data reported by it still remains in Pushgateway and needs to be done manually.
Job/Exporter
Both Job and Exporter are target monitoring objects of Prometheus; the mechanism of exporter is to expose monitoring data, and Prometheus collects these indicators; each exporter needs to be maintained separately. If there are too many, you can consider using Telegraf for unified management.
Service Discovery
Compared with reading file configurations, the monitored instances in cloud native and container environments will change dynamically. Through service discovery, we can easily obtain the instance information of the target that needs to be monitored; the relabeling mechanism in service discovery can obtain metatag data from the target instance, thereby distinguishing different development environments.
Alert manager
Prometheus separates data collection and alarms into two modules. The alarm module is called Alertmanager. It is a component independent of Prometheus and needs to be deployed separately. Multiple Alertmanagers can be configured as a cluster to avoid single point problems. Alarm rules are configured on Prometheus Servers. When alarm information is generated, AlertManager will be notified. AlertManager will aggregate through silencing, inhibition, etc., and send alarm prompts through email, PagerDuty, HipChat, Slack, etc.
Dashboard Web UI, Grafana, API Client, etc. are collectively called Dashboard.
Limitations
- Prometheus is a metrics-based system and is not suitable for storing logs.
- Prometheus believes that only recent data needs to be queried, so local storage will only save short-term data; historical data above TB level needs to be used with remote storage such as OpenTSDB
- Prometheus’s cluster solutions include federation and open source Thanos, but both have various detailed technical problems (such as exhaustion of CPU and machine resources), and their maturity is not as mature as InfluxDB, which ranks first among time series databases.
2 Data model
2.1 Time series data
Prometheus stores time series data, which is a metric defined by name, label and value; all indicators in Prometheus are time series data and are distinguished by names and labels; data with the same name and label belong to the same time series, and these time series data have different timestamps.
Indicator naming
The name of the indicator consists of ASCII characters, numbers, underscores, and colons, and satisfies the regular expression [a-zA-Z0-9_:]*. The name should be semantic and used to represent a measurable indicator, such as http_requests_total; the timing label can be used to distinguish different specific methods and parameter variables, such as http_requests_total{method="POST"}.
The naming of a metric should have the following characteristics:
Use the namespace or application name as a prefix to avoid conflicts with the same name in different scopes, such as prometheus_notifications_total, http_request_duration_seconds
Use the basic unit (seconds, meters, bytes, number, etc.) as the suffix, such as http_requests_total, node_memory_usage_bytes
Extract the common logical part of all tags as names, and use variable variables as part of the tags
Indicator type
Metrics are the core of the entire monitoring system. There are four types of Metrics Type in Prometheus:
- Counter
Counter is a counter that only increases but does not decrease. It is generally used to record the total number of service requests, returns or errors. It will be reset to 0 when the program is restarted. For example, http_requests_total in Prometheus Server represents the total number of http requests currently processed.
In order to visually display the changes in indicator data counts, it is generally necessary to calculate the growth rate of Counter data. It is recommended to use functions such as rate, topk, increase, irate, etc. in PromQL.
- Gauge
Gauge represents snapshot data that can be changed arbitrarily, and is generally used to record memory usage, CPU temperature, the number of goroutines in the program, etc. For example, go_goroutines in Prometheus Server represents the current number of goroutines.
Gauge is often used in combination with the maximum value max, minimum value min, sum function in PromQL, or the time series prediction function predict_linear based on linear regression, to obtain the delta function of the change of indicators within a period of time.
- Histogram
Histogram is used to sample data within a certain time range and record the number of data in each bucket. For example, prometheus_local_storage_series_chunks_persisted in Prometheus Server represents the number of chunks that need to be stored for each time series. We can use histogram_quantile to calculate the quantile quantile data of the data to be persisted.
- Summary
Summary is similar to Histogram and is also used to represent data sampling results within a period of time. It directly stores quantile data (calculated through the client) instead of calculating it based on statistical intervals. For quantile calculation, Summary has better performance when querying through PromQL, while Histogram consumes more resources. On the contrary, for the client, Histogram consumes fewer resources.
2.2 Data collection
The data collection of Prometheus server is based on the Pull model. Its workflow is roughly as follows. Prometheus server will regularly obtain the data of the metrics structure from the exporter through the HTTP interface and store it. If Prometheus Server and Exporter cannot communicate directly, then we can push the data on the exporter to Pushgateway and let Prometheus Server obtain the data from PushGateway.
Terminology
Exporter: All programs that provide data to the Prometheus server can be called exporters. Prometheus server will periodically pull data from the HTTP service URL provided by the exporter. We only need to add a target in the configuration file /etc/prometheus/prometheus.yml of the Prometheus server and restart the service to locate the exporter and pull the data.
Instance: Any independent data source target can be called an Instance instance, which is the smallest unit used to provide data.
Job: A collection containing instances of the same type is called a Job, such as the same process in an elastically scalable set of pods that are replicated on a k8s cluster.
2.3 Pushgateway
Since Prometheus server uses pull mode to obtain data, if Prometheus server and exporter cannot communicate directly because they are not in the same subnet environment or due to firewall reasons, or when we need to aggregate data from multiple exporters, we can actively push the data to Pushgateway and collect data indirectly; but its disadvantage is also obvious, that is, it is a single point of failure. If the only Pushgateway is unavailable, then all data cannot be obtained by Prometheus server.
Pushgateway does not require any configuration and can be used directly after starting the docker image.
docker pull prom/pushgateway

docker run -d -p 9091:9091 prom/pushgateway
After starting Pushgateway, you need to add Pushgateway to the static configuration of the Prometheus server:
docker exec -it --user root f257794e5e3d sh
vi /etc/prometheus/prometheus.yml
scrape_configs:
  - job_name: "pushgateway"
    static_configs:
      - targets: ["ip:port"]
After modifying the configuration, send a signal to Prometheus Server to load the latest configuration:
kill -HUP $pid
By default, Pushgateway stores all data in memory, so once the Pushgateway service stops running due to a failure, all data that has not been obtained by the Prometheus server will be lost. For this reason, the data can be persisted by specifying the persistence.file parameter when starting the Pushgateway service:
pushgateway --persistence.file="/tmp/pushgateway_persist"
By default, files are persistently written every five minutes. We can adjust this by modifying the persistence.interval parameter.
Push data
When pushing data to Pushgateway, you can use the PUT and POST methods. PUT will replace all metrics in the instance with newly pushed metrics, while POST will only replace metrics with the same name (provided that this part of the data is under the same job/instance);
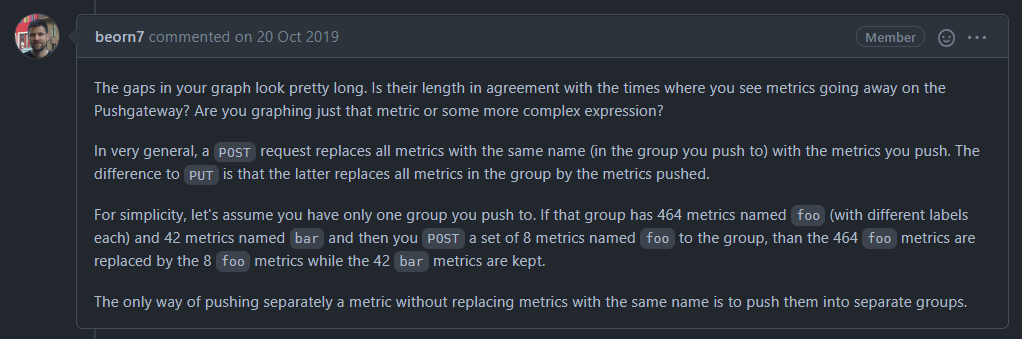
Assume that the data to be pushed is as follows:
$ cat req1.txt
# TYPE foo GAUGE
foo{id="1"} 1
foo{id="2"} 2
foo{id="3"} 3
# TYPE bar GAUGE
bar{id="11"} 11
Push it to Pushgateway and check:
$ curl -X POST --data-binary @req1.txt localhost:9091/metrics/job/test

$ curl localhost:9091/metrics | grep test
bar{id="11",instance="",job="test"} 11
foo{id="1",instance="",job="test"} 1
foo{id="2",instance="",job="test"} 2
foo{id="3",instance="",job="test"} 3
Use the POST method to push another set of data:
$ cat req2.txt
# TYPE foo GAUGE
foo{id="4"} 4
foo{id="5"} 5

$ curl -X POST --data-binary @req2.txt localhost:9091/metrics/job/test
$ curl localhost:9091/metrics | grep test
bar{id="11",instance="",job="test"} 11
foo{id="4",instance="",job="test"} 4
foo{id="5",instance="",job="test"} 5
You can see that the original data named foo has been overwritten;
Use the PUT method to push the second set of data:
$ curl -X PUT --data-binary @req2.txt localhost:9091/metrics/job/test
$ curl localhost:9091/metrics | grep test
foo{id="4",instance="",job="test"} 4
foo{id="5",instance="",job="test"} 5
You can see that all the original data (including bar data with different names) has been overwritten.
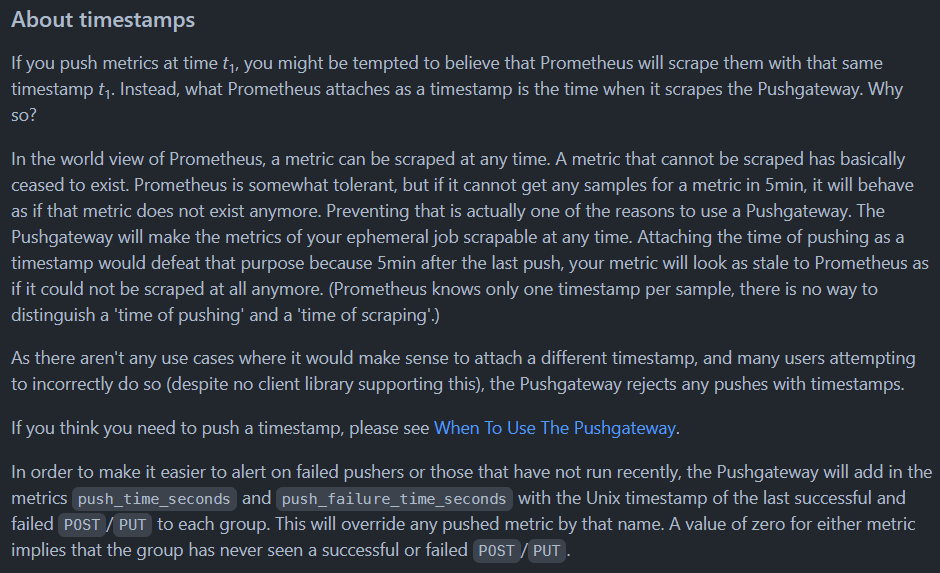
Pushes cannot contain timestamps
When Prometheus pulls data, it will not collect data that differs from the current time by more than 5 minutes. Officials believe that pushgateway is generally used for temporary tasks and batch jobs. In order to prevent these tasks from not existing long enough and causing Prometheus to end before it has time to pull the data, it is not allowed to bring a timestamp when pushing data to pushgateway.
Delete data
If you want to delete specific data on Pushgateway, you can use the official http API:
- Delete all data for a specific job and instance:
curl -X DELETE http://pushgateway.example.org:9091/metrics/job/some_job/instance/some_instance
- Delete a specific job and all data under instance="". Note that this will not delete data from other instances:
curl -X DELETE http://pushgateway.example.org:9091/metrics/job/some_job
- Delete all data on an instance (you need to add the parameter
--web.enable-admin-apiat startup to use it):
curl -X PUT http://pushgateway.example.org:9091/api/v1/admin/wipe